Building Smarter White-Label Apps with Modular SDKs
Leandro Pontes Berleze | Mar 12, 2026

Autoscaling is one of the most powerful promises of Kubernetes, but also one of the most misunderstood. Many teams rely on default CPU — or memory — based autoscaling, only to discover that their cluster does not scale when it should, especially for asynchronous workloads (e.g., Celery workers, Kafka consumers, ETL services, etc.).
In this guide, we’ll walk through a production-proven autoscaling strategy that goes far beyond basic resource metrics. You’ll learn how to combine:
This is the exact architecture we use to scale Celery-based workloads under high demand, and it has proven to be resilient, predictable, and cost-efficient.
Whether you’re building search pipelines, background processors, event-driven systems, or AI inference services, this tutorial provides a definitive scaling blueprint for Kubernetes.
Kubernetes’s default horizontal autoscaling relies on CPU and memory, but with asynchronous or queue-driven systems, those metrics don’t reflect real pressure.
For example:
Meanwhile, users wait longer and longer.
The truth is: To autoscale correctly, you need semantic metrics that describe the real workload, like queue depth, worker utilization, event lag, etc. In this tutorial, we’ll scale based on what actually matters, not what the kernel reports.
Also, read it: Cross-Platform Migration: Why It Works
Autoscaling will follow this flow:
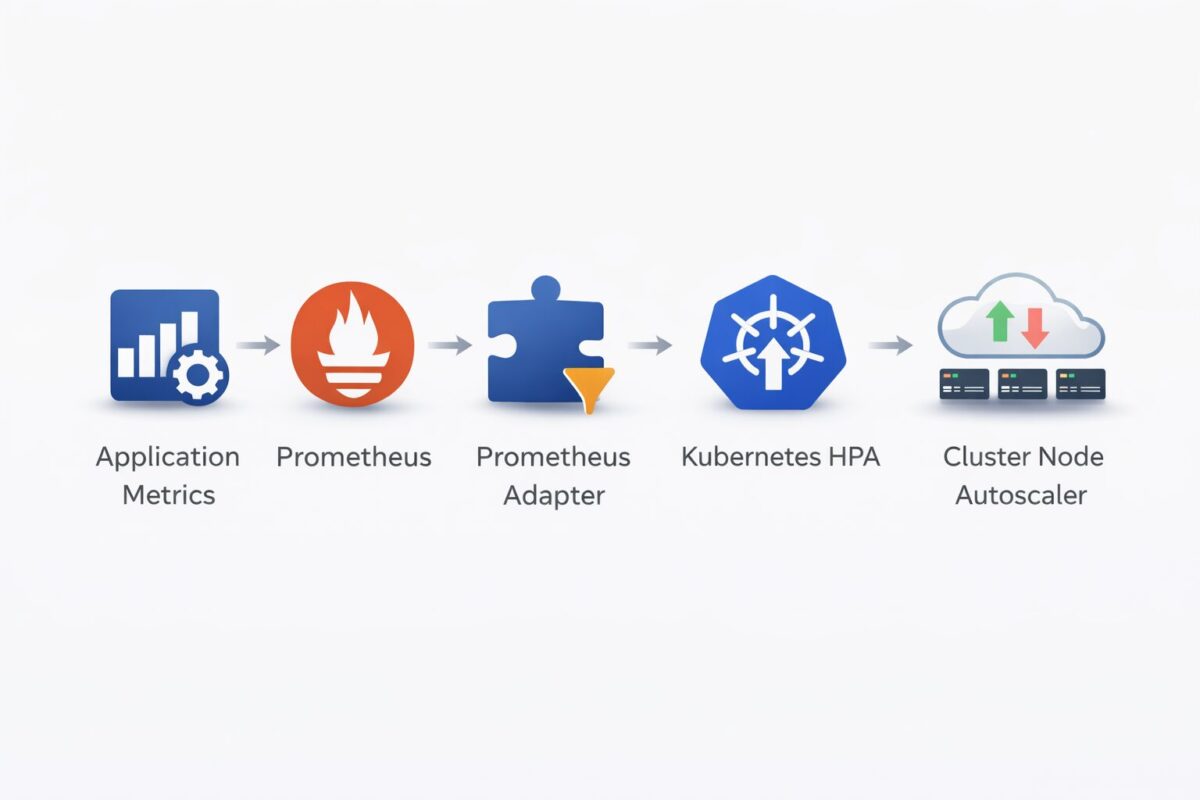
We will implement each layer step-by-step.
First, expose the metrics your autoscaler will use.
For Celery, we typically output:
Example endpoint structure (Python/Flask style):
@app.route("/metrics/celery")

def celery_metrics():

    queue_depth = get_queue_depth()

    busy_ratio = get_busy_workers_ratio()

    return f"""

    celery_queue_depth {queue_depth}

    celery_workers_busy_ratio {busy_ratio}

    """, 200, {"Content-Type": "text/plain"}Code language: PHP (php)
Expose it inside Kubernetes via a Service:
apiVersion: v1

kind: Service

metadata:

  name: worker-metrics

spec:

  selector:

    app: my-worker

  ports:

    - name: metrics

      port: 8000

targetPort: 8000Code language: HTTP (http)Prometheus must scrape the metrics endpoint.
Add the following to your Prometheus values.yaml:
extraScrapeConfigs: |

  - job_name: 'worker-celery-metrics'

    metrics_path: /metrics/celery

    scrape_interval: 15s

    static_configs:

      - targets:

        - 'worker-metrics.default.svc.cluster.local:8000'Code language: JavaScript (javascript)
This ensures Prometheus scrapes celery_queue_depth and celery_workers_busy_ratio every 15 seconds.
Kubernetes Horizontal Pod Autoscalers cannot consume Prometheus metrics directly. To bridge this gap, the Prometheus Adapter is deployed as a separate component in the cluster, usually via its own Helm chart and configuration file, commonly in a shared namespace such as monitoring.
The adapter connects to Prometheus, runs predefined queries, and then exposes the results through the Kubernetes External Metrics API (external.metrics.k8s.io). These metric-mapping rules are defined exclusively in the Prometheus Adapter configuration and are what make custom application metrics, such as Celery queue depth or worker utilization, available for autoscaling.
Example adapter configuration:
rules:

  external:

    - seriesQuery: 'celery_queue_depth{job="worker-celery-metrics"}'

      name:

        as: 'celery_queue_depth'

      metricsQuery: 'avg(celery_queue_depth)'

    - seriesQuery: 'celery_workers_busy_ratio{job="worker-celery-metrics"}'

      name:

        as: 'celery_workers_busy_ratio'

      metricsQuery: 'avg(celery_workers_busy_ratio)'Code language: JavaScript (javascript)
Once deployed, these metrics can be queried by Kubernetes and referenced directly by Horizontal Pod Autoscalers.
These can be inspected with:
kubectl get --raw "/apis/external.metrics.k8s.io/v1beta1" | jq

You should see:

celery_queue_depth

celery_workers_busy_ratioCode language: JavaScript (javascript)Once custom metrics are exposed through the Prometheus Adapter, Kubernetes can use them to make autoscaling decisions. This is done through the Horizontal Pod Autoscaler (HPA), which adjusts the number of pod replicas based on real workload pressure rather than CPU or memory usage alone.
In this setup, the HPA scales worker pods based on external metrics and is configured to scale worker pods using external metrics such as queue depth and worker utilization. These metrics reflect how much work the system is actually processing, making scaling decisions more accurate and responsive.
Example HPA configuration (using Helm):
autoscaling:

  enabled: true

  minReplicas: 2

  maxReplicas: 10

  metrics:

    - type: External

      external:

        metric:

          name: celery_queue_depth

        target:

          type: AverageValue

          averageValue: "10"

    - type: External

      external:

        metric:

          name: celery_workers_busy_ratio

        target:

          type: AverageValue

          averageValue: "1"Code language: JavaScript (javascript)
With this configuration:
When scaling based on external or workload-driven metrics, it is important to also configure HPA behavior parameters. Without them, the autoscaler may react too aggressively to short-lived metric spikes, leading to rapid scale-up and scale-down cycles (“flapping”).
By defining stabilization windows and scaling policies, you can ensure that scaling decisions are smoother, more predictable, and aligned with sustained workload trends rather than transient noise.
Example behavior configuration:
behavior:

  scaleUp:

    stabilizationWindowSeconds: 300

    policies:

      - type: Pods

        value: 1

        periodSeconds: 60

  scaleDown:

    stabilizationWindowSeconds: 300

    policies:

      - type: Pods

        value: 1

        periodSeconds: 60
This configuration limits how frequently replicas can be added or removed and gives the system time to absorb changes in demand before making further adjustments. In production environments, especially when autoscaling from queue-based metrics, proper HPA behavior tuning is essential to avoid instability and unnecessary resource churn.
This is semantic autoscaling, scaling driven by business logic.
Also, read it: Nearshore Staff Augmentation: A Guide For Your Business
Pod autoscaling only works when the cluster has enough compute capacity. To automatically add or remove nodes, a cluster autoscaler must be enabled. This can be implemented using the platform’s preferred solution (such as the native Kubernetes Cluster Autoscaler, Karpenter, or a cloud-provider managed autoscaler) and configured either via infrastructure-as-code tools or directly through the cloud console. In this guide, node autoscaling is enabled using Terraform, but the same concepts apply regardless of the tooling or autoscaler implementation used.
Generic Terraform example:
resource "azurerm_kubernetes_cluster" "example" {

  name                = "autoscaling-cluster"

  location            = "eastus"

  resource_group_name = azurerm_resource_group.example.name

  dns_prefix          = "example"

  default_node_pool {

    name                = "default"

    vm_size             = "Standard_D4s_v3"

    node_count          = 2

    enable_auto_scaling = true

    min_count           = 1

    max_count           = 5

    mode                = "System"

  }

  identity {

    type = "SystemAssigned"

  }

}Code language: JavaScript (javascript)
Behavior:
This ensures:
This is essential for any scalable production Kubernetes system.
Check HPA decisions:
kubectl describe hpa -n defaultCode language: JavaScript (javascript)Check external metrics:
kubectl get --raw "/apis/external.metrics.k8s.io/v1beta1/namespaces/default/celery_queue_depth"Code language: JavaScript (javascript)Check pending pods:
kubectl get pods -A | grep PendingCode language: JavaScript (javascript)Check node autoscaler actions:
kubectl get nodes

kubectl describe node <name>Code language: HTML, XML (xml)Autoscaling Kubernetes isn’t just about turning on HPAs. Real-world autoscaling requires application-aware metrics, smart decision-making, and infrastructure elasticity.
By combining:
You build a cluster that reacts to real demand, scales smoothly under pressure, and minimizes cost during idle periods.
If your applications rely on queues, background processing, or any asynchronous workloads, this scaling strategy is not just ideal. It’s essential.
This is the definitive way to autoscale Kubernetes.
If your engineering team wants help implementing this pattern or wants to scale more advanced workloads (AI, search pipelines, ETL, etc.), feel free to reach out!