Scaling AI: A 6-Month Path from Champions to Company-Wide
Douglas da Silva | May 27, 2026

In the Tolkien’s universe, twenty Rings of Power were forged and given as gift to the rulers of Middle-Earth, the Elves, the Dwarfs and the Humans. There were Three rings for the Elven kings under the sky, the most powerful of the twenty, after the One ring.
In our universe, a lot of tools were created and given as gift to the rulers of the Earth. If we focus on technology, more precisely in mobile metrics, we can say that there are Three tools for the Analytics kings under the sky – and they are as powerful as the elven rings.

Let’s say that you had a mobile app idea, started to work on it, and finally started the development process. Everything is running ok and the screens looks gorgeous, but you feel that something’s missing: Data.
You may know how much users downloaded the app or started a session, but there is no info about which screen they opened or which button they clicked. Maybe you are trying to create a better search performance, but, in fact, the users are more attracted to the timeline than to the search, which is used by only 5% of your users. How to know about it? Metrics.
But how and where should the data be sent? How much will it cost?
I researched and tested three tools: Google Analytics, Firebase and MixPanel.
I’m glad to show you about them in the next lines, giving them a personal score and hoping to help you with this decision.
The Ring Tool of Water, of preservation and protection. Some may say it looks more like a star than a ring tool.
You have probably heard about or even used Google Analytics (GA). It is the oldest one among the three tools, forged launched in 2005 and is widely used. If you mention that your product doesn’t have metrics implemented, you can hear something like “Not even Google Analytics?”.
It was the first platform that I ever used to metrify mobile apps. The setup is easy, the docs are great and it works very well. It also has some out of the box features, like screen funnels, and even allows you to create custom dashboards.
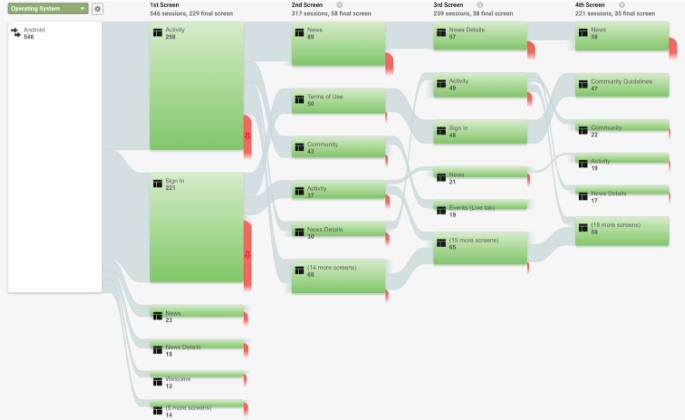
You can also set Custom dimensions to the tracked events, so you can add more info to it, like a search query into the performed search event. A setup is needed to use this feature, but there’s a good doc for it.
There is a Real-Time view that allows you to see tracked events “live” and it works very well, with very little delay, but you can’t check the custom dimensions in this view.
So if you want to check the custom dimension for a tracked event you need to wait for it to be “flushed” and be available at the Behavior session, which can take a few hours to happen.
You can show your data in a great way for your team with Google Data Studio.
GA is a great tool. There are some features in Beta version, so it’s still in development and maintenance, but there are some reasons for this score.
The setup tutorials recommend you to use Firebase as the tracking solution for Google Analytics.
Also, for you to extract more info, like custom funnels and formulas, that are not an out of the box feature, you have to study it deeper. Fortunately, Google offers online courses for it.
Good to mention that it’s free if you are not an enterprise with high traffic volume (otherwise it could cost $150,000/year USD).
The Ring Tool of Fire, that gives hope and helped Gandalf to fight with the Balrog.
Firebase was forged founded in 2011 and acquired by Google in 2014. It is a HUGE platform and has a lot of functionalities, like authentication, database, storage, notifications, A/B testing, analytics and more.
If you already use Firebase for anything else, like notifications, some data will already be there, like the Screens and infos related to the app, like First Opens and App Remove.
Firebase’s Dashboard is similar to the GA’s Home, but there is an easier access to create funnels and perform some other analysis.
In contrast, there is no screen funnel like the GA has.
Firebase has many default events, like Search, Sign Up and Login. If you want to know more about them, their doc is great.
You can send Parameters with the event to add more info to it, like the GA’s Custom Dimensions, but they have a restricted view.
Firebase allows you to link your data to other platforms, like BigQuery, that can perform analysis even more in details and can be used to Google Data Studio, but you need to upgrade your account for it.
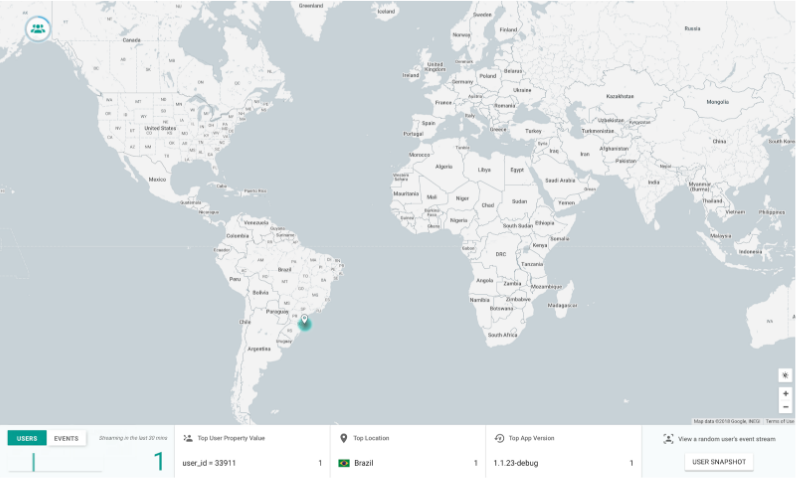
Firebase has a StreamView that shows you where in the globe people are using your app right now, allowing you to check out user snapshot’s in real time. Also, the tracked events are “flushed” to the Events dashboards in minutes.
Firebase is the Google recommended tool, allowing more in deep analyze of your data.
The other features are a great point for Firebase, allowing you to create an app using only Firebase as the server with the database and authentication functionalities.
The Dashboard is more punctual, but the lack of the screen funnel is a negative point.
The event names pattern are also a negative point, and having in mind that linking with BigQuery is only possible to do with an upgraded account. It may require you a greater effort to present the data to, for example, the marketing team.
The Firebase Analytics is totally free, but other tools of the platform may need an upgrade, and there are 3 pricing plans.
The Ring Tool of Air, may be considered the mightiest of these three bands, possessing the power to heal and to preserve.
Forged Founded in 2009, MixPanel is a great platform that also has functionalities like notifications and A/B testing, but its main focus is on analytics.
Their doc is not that good, the Android samples are all in Java (at Cheesecake Labs we use Kotlin), some screenshots are outdated, but it could be worse.
With MixPanel you create your own dashboard, including the reports you want to see there and allowing you to send email digests of this info for whoever you want.
The additional infos of the tracked events are called Properties, and are sent to the SDK as a JSON object with key value pairs.
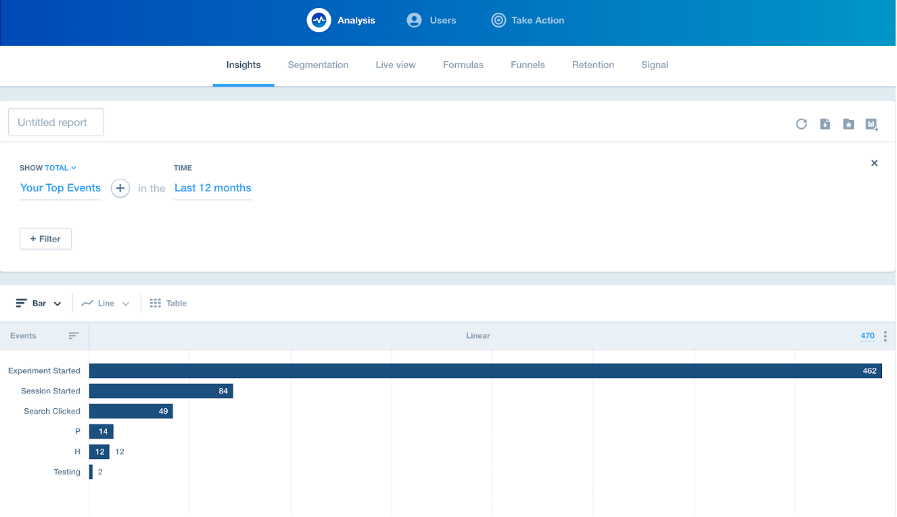
The Analysis session has a lot of tools that are very simple to setup and with results that are easy to understand, making the analysis of your data the best possible.
Insights is a report that can be customized for event and period of time. I consider this the “default events view”.
To segment the analysis of an event by a dimension, that is what Segmentation is for, and the results can be very interesting.
The Live View works very well, taking only seconds to show the events, and after you see the data there, you can already use them to your analysis.
Formulas allow you to understand the relation between events.
Funnels are the way to know how many users don’t complete a sequence of actions (e.g. sign up, agree with terms and conditions, and complete a profile), and MixPanels has a great result view.
Retention is the traditional check of users coming back to the app.
The last of this session, but not least, Signal, helps to understand actions that drive users to convert or retain.
MixPanel also has a Users session to Explore, Cohort and Predict. Explore give you access to the user’s properties (device related), including all the tracked events and an action where you can interact directly with e-mail or notification. At Cohort you can group users that have a similar behavior in a period of time. While Predict tells you which users are likely to convert based on what they do and who they are.
The Take Action session is for Campaign, Messaging and A/B testing.
The layout and the way the results are shown are the great part of MixPanel. Everything is crystal-clear.
It’s also the faster tool to check out the tracked events.
The tools to analyze your data are right in front of you, with video tutorials to help you and, if you still have some doubts, there is a Support chat in the bottom right corner.
The most negative point of MixPanel comparing to GA and Firebase is related to the screen tracking, since it’s not an out of the box functionality.
There are also 3 pricing plans, starting from Free going to Startup, that allows more members to the project and more time for the data history for $999/year, ending at Enterprise, with unlimited data history and premium support, and to get to know the price you need to contact them.
In the end, it’s up to you, but if you question me about metrics at Prancing Pony, I would say something like this:
If you are a data scientist of a huge app that contains a lot of traffic with a lot of data to analyze and the price is not a problem, I would say to you to go with MixPanel. It probably will make your life easier, not only understanding your users and your data, but presenting it to your teammates too. Probably if this is your case, the price of the platform will not be an obstacle.
But in the case that the price really matters or if you don’t have that high traffic volume, I would like to suggest you to go with Google Analytics having in mind the Google Data Studio integration and the event names without a certain pattern, but you know, Firebase is the most up-to-date and I’m afraid of a depreciation of GA.
In other case, if your app is completely new and you don’t even have a Back-end developer for the database and authentication part, Firebase is the right platform for you.
Thanks and good analysis for we all!
The post compares Google Analytics, Firebase, and MixPanel as three tools for mobile analytics.
Google Analytics received a score of 7, Firebase received a score of 8, and MixPanel received a score of 9.
Google Analytics is easy to set up, has great docs, offers out-of-the-box features like screen funnels, custom dashboards, and integration with Google Data Studio. It's free unless you're an enterprise with high traffic volume (which could cost $150,000/year USD). However, setup tutorials recommend using Firebase as the tracking solution, and extracting deeper info like custom funnels and formulas requires further study. Custom dimensions also can't be checked in the Real-Time view.
Firebase is a huge platform with functionalities like authentication, database, storage, notifications, A/B testing, and analytics. It has many default events (Search, Sign Up, Login), a StreamView for real-time global usage, and events flush to dashboards in minutes. Firebase Analytics is totally free, though other tools may need an upgrade across 3 pricing plans. Negatives include the lack of a screen funnel and requiring an upgraded account to link with BigQuery.
MixPanel's layout and result presentation are crystal-clear, and it's the fastest tool to check tracked events. It offers analysis tools like Insights, Segmentation, Formulas, Funnels, Retention, and Signal, plus user features like Explore, Cohort, and Predict. Negatives include documentation that isn't great, Android samples in Java (while Cheesecake Labs uses Kotlin), and screen tracking not being out of the box. It has 3 pricing plans: Free, Startup ($999/year), and Enterprise.