Custodial vs. Non-Custodial Wallets: Key Differences and How to Choose
Bruno Nascimento | May 30, 2025

By definition, user engagement is exactly what the name suggests. For a mobile app to work well, users should understand its main value proposition to then keep using it repeatedly until it becomes an essential part of their life.
According to eMarketer, nearly 200 billion apps will be downloaded in 2017. In contrast, currently about 25% of downloaded apps aren’t used more than once. Creating an engaging user experience is increasingly becoming essential as brands develop their mobile presence and hope to meet user expectations. Based on this data, how can we change the upcoming scenario for 2017? By tracking user engagement metrics and using these to create solutions to possible problems.

When it comes to engagement, there is no better or worse metric. Knowing the main value proposition of your app will help understanding which is the most relevant metric to measure. To do so, here are some basic ways to analyze the subject:
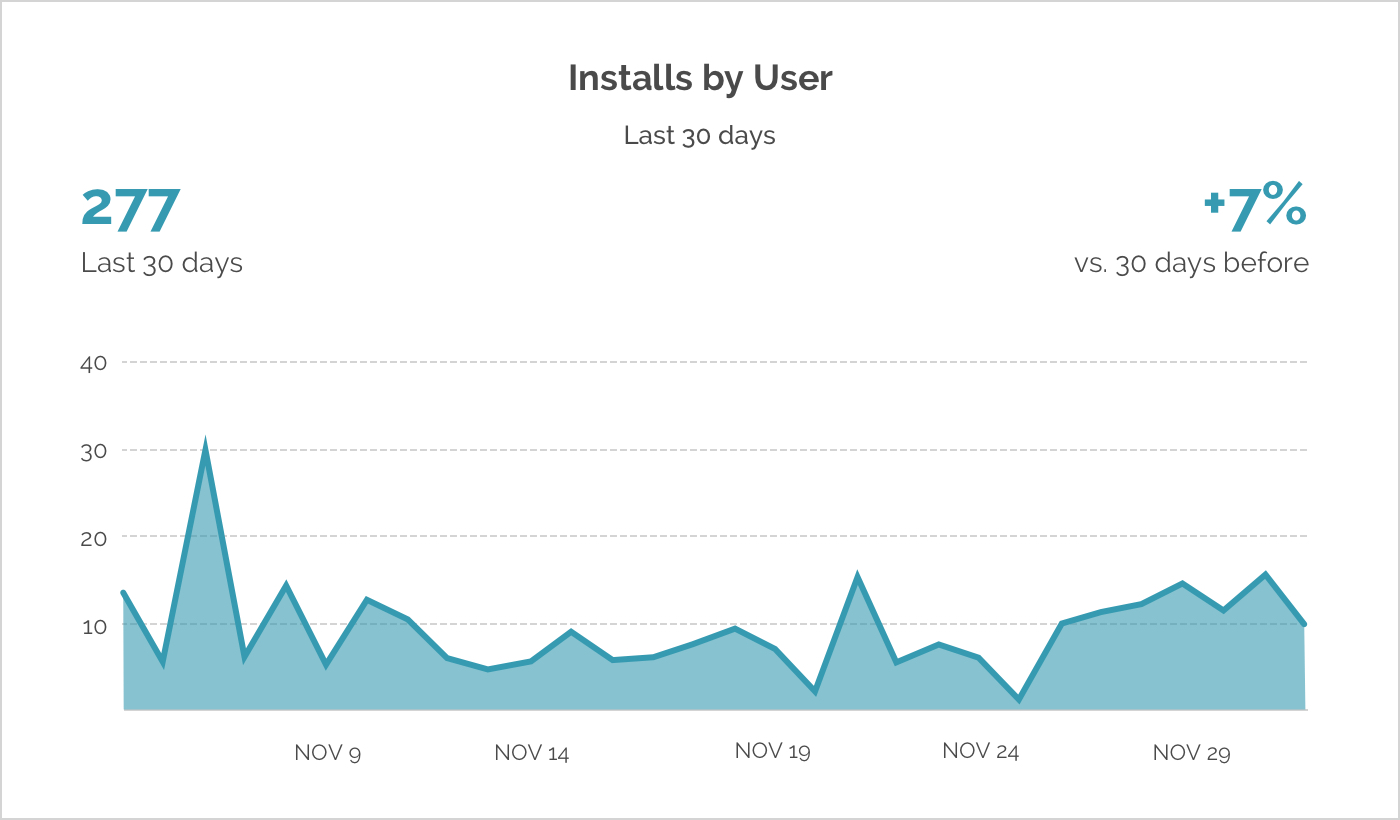
According to Statista, there are about 1.8 million apps in Google Play and 1.5 million in the Apple App Store. Reaching a large number of downloads is one of the first steps to be taken to achieve app success. Many consider this number the most important metric to evaluate success, since the main objective is to consolidate a broad user base.
From a marketing point of view, understanding the source of your app installs is also very important. Tracking this metric will help you evaluate the effectiveness of your advertising channels and marketing efforts.
Tools: Apple App Store, Google Play
2. Users (Not just new – all)
Tracking users is fundamental to create a deeper engagement, like segmenting audiences, tracking specific behavior and launching successful app marketing campaigns.
User data can be measured through Monthly Active Users (MAUs), Week Active Users (WAUs) or Daily Active Users (DAUs). These metrics can be broken out by demography, device, gender, age, when and where the users are accessing your app and many other. Understanding these numbers helps planning for the growth (or not) of your app, in addition to measuring engagement. What is the use of various downloads and installations if we don’t have no active users in the app?
Tools: Google Analytics, Fabric, HockeyApp
3. Active Users
The active user metric is different from downloads and installations metric, since it measures if users are actually using the app rather than just downloading but not regularly using it. Many analytics tools come with their own criteria for an “active user”, usually revolving around the “session”. The session itself can vary depending on the tool. Google Analytics, for example, considers a user session as when the user opens and interacts with the app until 30 minutes of inactivity.
This is a good number to give you a sense of app growth, but isn’t enough to measure engagement alone. Of course, first of all you should define what is an active user on your app.
The active users number should be higher than the new users number. This indicates that there are recurring users in the app, that is, users who use the app more than once.
Tools: Google Analytics, Fabric

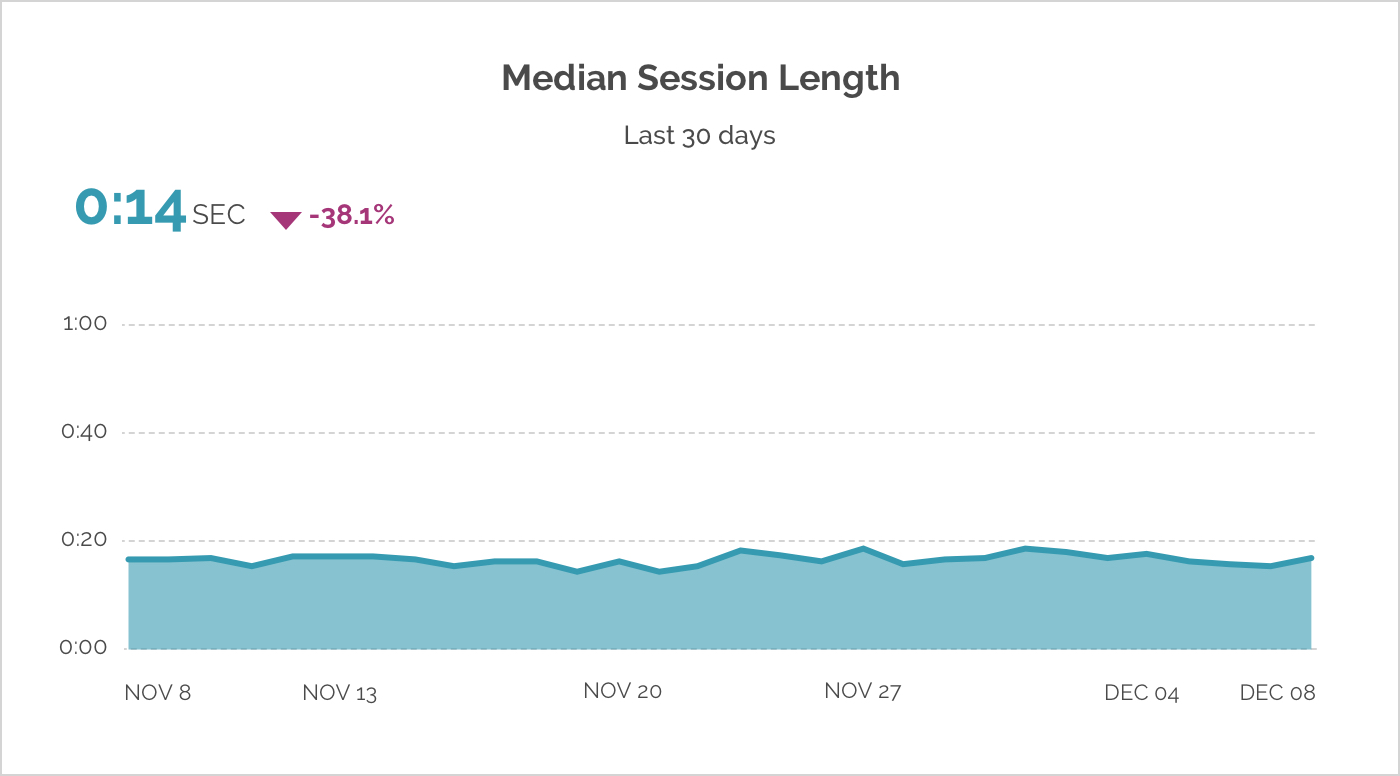
4. Session length
It’s the measure of the time period between the opening and closing of an app by the user. This metric indicates how long your users are spending in your app by individual session. When the user are more engaged, the session duration will be greater.
From the moment you cross this information with what the users did on the period, you understand what else can be generating value for users.
Tools: Google Analytics, Fabric
5. Session Interval
Session Interval indicates the time between two consecutive sessions, showing the frequency in which users open and use the app. The frequency allows you to take a look at the immediate value generated by the installation and execution of an app. Maybe it doesn’t provide direct inputs for improvements, but certainly quantifies the retention value and stickiness of your app.
Tools: Google Analytics
6. Time in App
Time in app measures how long users stay on an app over a certain period of time, for example, social media app users spend 30 minutes per day on average in the app. It’s a metric that helps identifying how frequently the app is used and its value to users. Similar to session interval and duration, this engagement metric helps understanding user behavior over time and gives a clear view of app usage patterns.
If users are or not opening the app, you need to evaluate what is the reason. “Why are they using the app for long or short periods of time?”, “Are user’s screen flow similar?”, “Are they buying more or just searching?”. Raise questions like these to think of solutions to help increasing app usage and engagement.
Tools: Google Analytics, Fabric

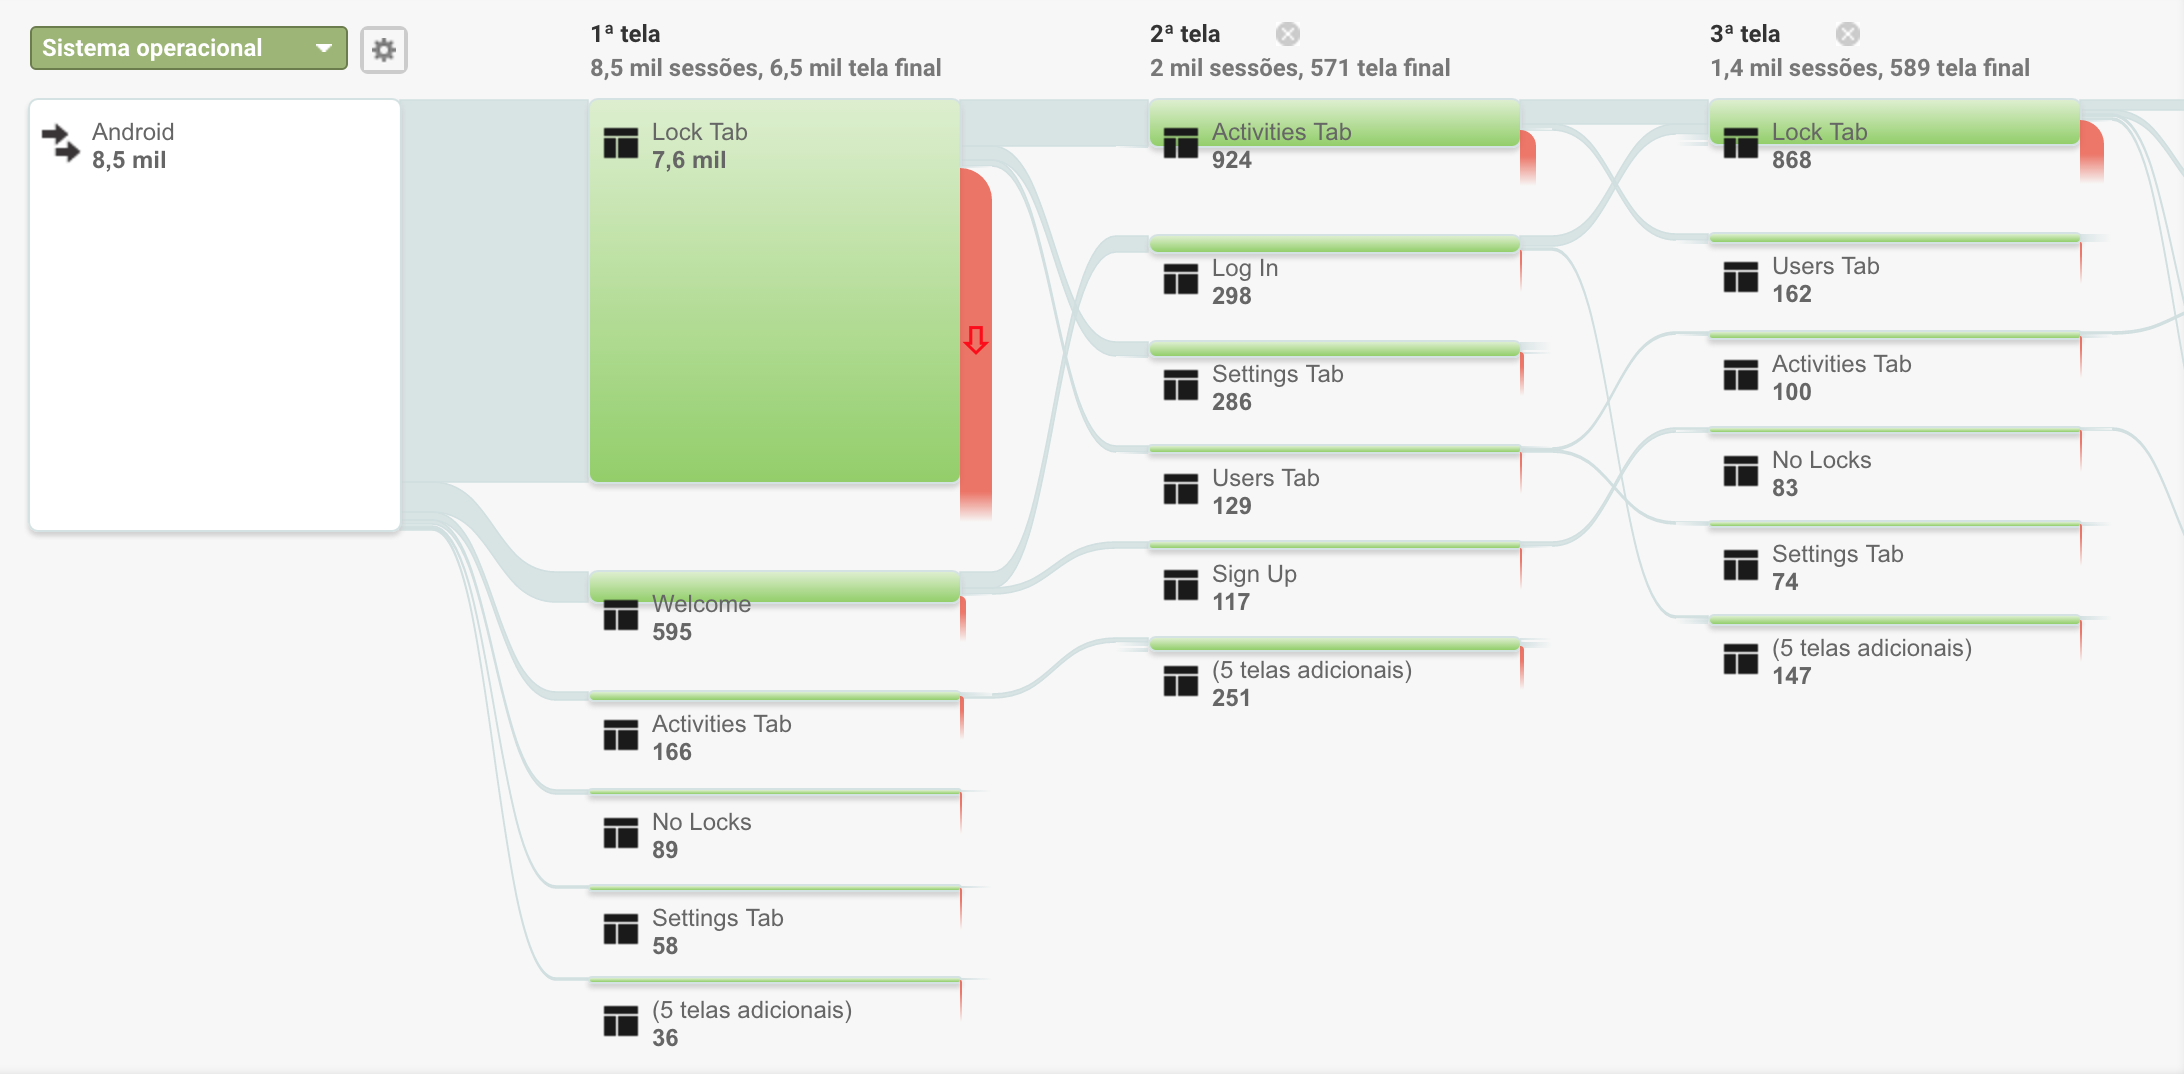
7. Screen Flow
A screen flow analysis can be used to track exits by screen, the navigation flow between screens, and the total number of visits per screen, for example. It helps visualizing the interactions of your app’s typical visitor. With a screen flow analysis, you can look at a particular screen to see what users did while interacting with it and where they went afterwards. By looking at how users navigate in your app, you can get a clear sense of problem areas, conversion road bumps, and drop off screens.
This metric also shows you exactly what users who didn’t complete a certain task did instead, giving you insights on where to adjust your app’s flow to increase conversion. With this data in mind, you can implement redesigns to create clearer funnels, or create in-app marketing campaigns to re-engage dropped users.
Tools: Google Analytics
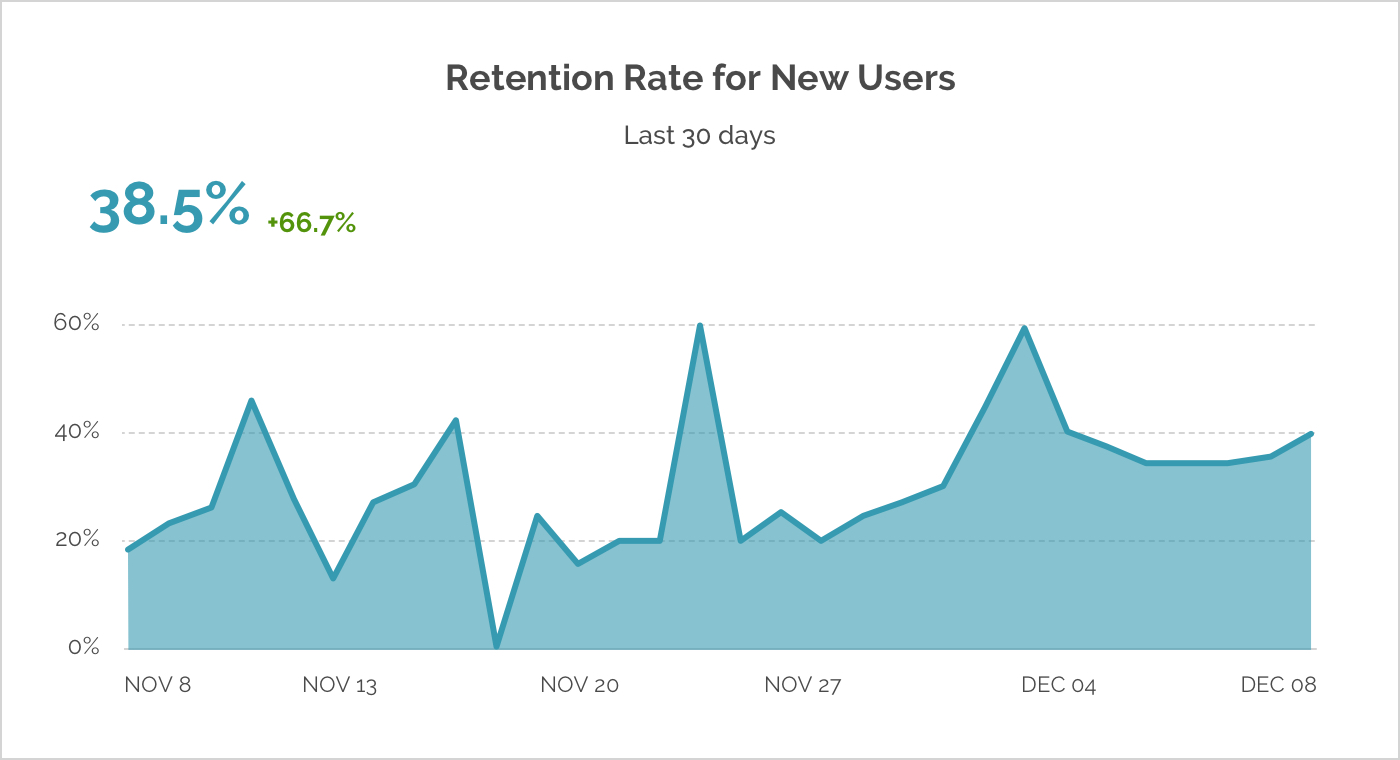
8. Retention Rate
It’s the percentage of users who returned to your app at least once in the last 30 days. In the mobile industry, retention rates are usually measured over the course of one business quarter (90 day period).
This metric helps to evaluate if user retention is improving or decreasing over time. It’s also good to measure across different devices and app versions.
Tools: Fabric
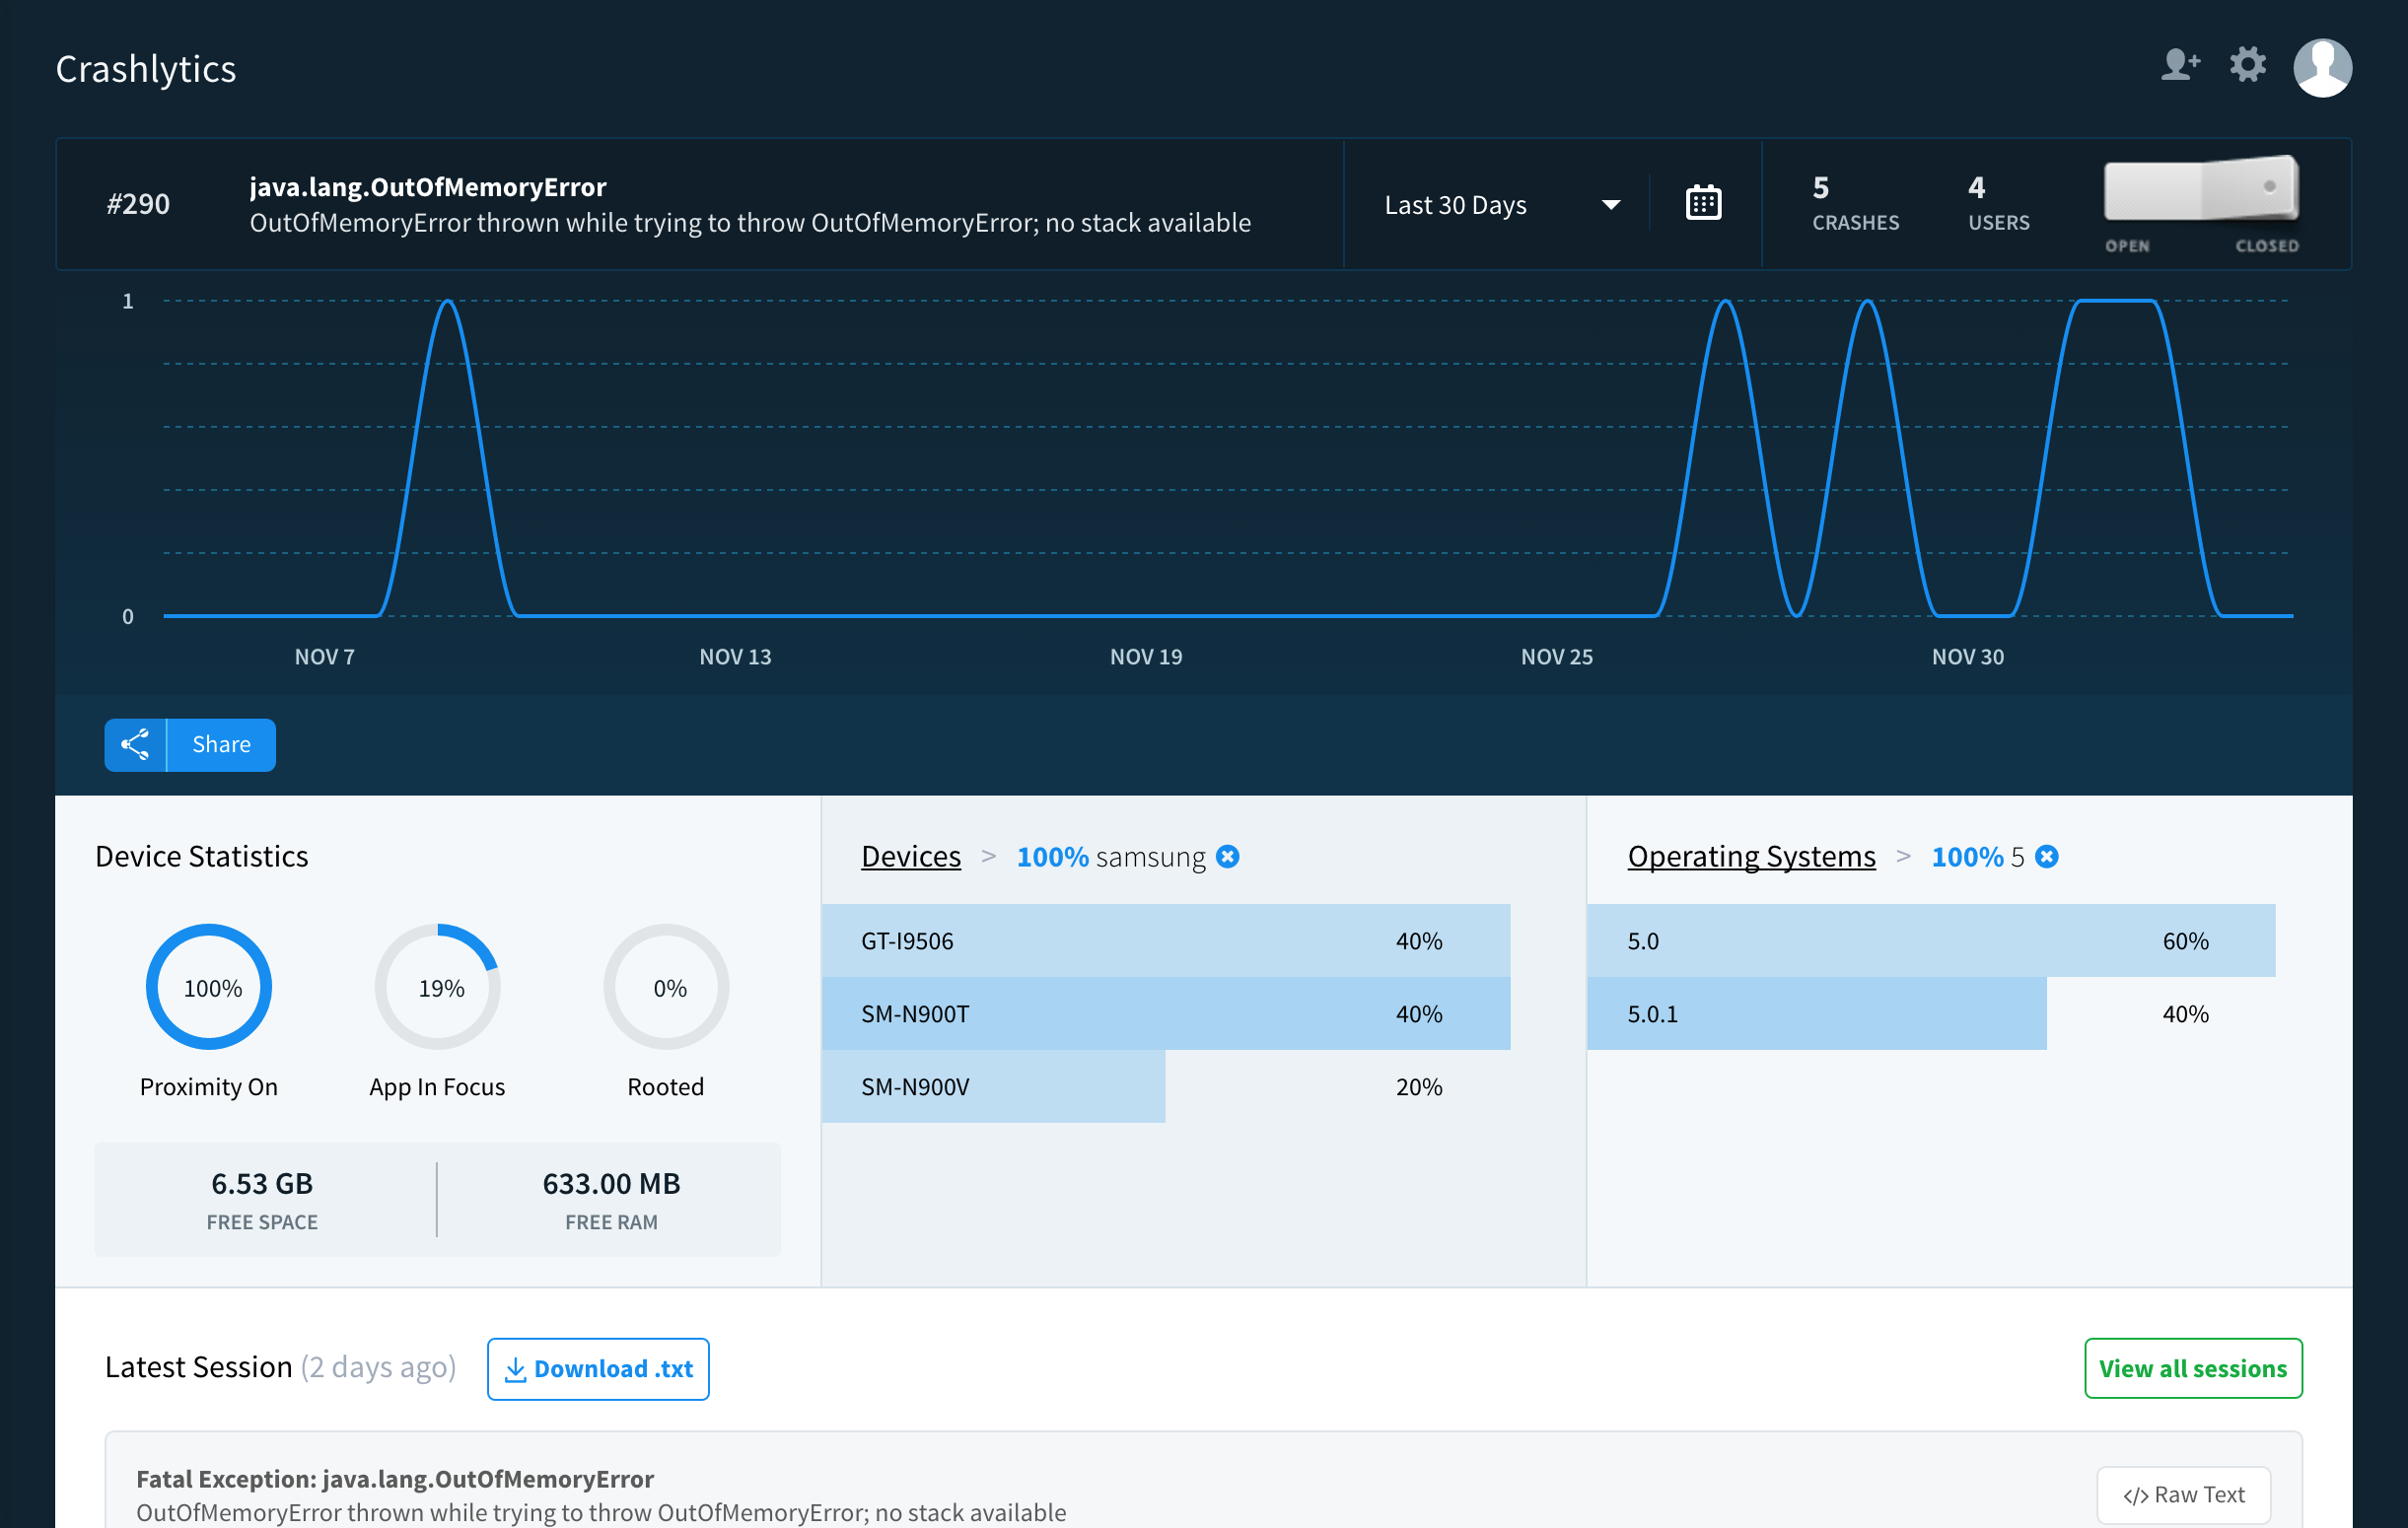
9. App Crashes
Tracking app crashes can help understanding the technical barriers that harm the user experience within your app. Crashes measure how often your app closes abruptly due to a bug or an error while a user is using it.
To reduce the number of crashes on the app, test app builds continually during development to identify issues right away. Gradually add more testers and create a beta group to catch as many problems as possible before launch.
Tools: Crashlytics, Instabug, HockeyApp, Parse, Xcode
10. Lifetime Value – LVT
Lifetime Value (LTV) is the total revenue that you earn from a user before he/she stops using your app. It’s important to note that it can take some time for a user to spend more money on your app to cover the cost of acquiring them.
It can be measured through a monthly average by user, which evaluates how much money that user can generate over a period of time. Also, there are formulas that can show the average revenue per customer.
Lifetime Value helps finding out how long you need to keep your users to generate profit. It will also help to predict how much money your product will make in the future.
Tools: Localytics or your main analytics package and whatever you use for tracking revenue.

Measuring and optimizing for the right engagement metrics is the key to attaining and keeping users. These metrics are your foundation for personalization: in truth, you can’t create a customized experience for app users without knowing about their in-app usage. However, understanding the “what” is only half of the battle. You also need to understand the “why”.

Analytics can help you track the effectiveness of your user acquisition and in-app marketing campaigns, while access to data can help your dig deep into user behavior – which is key to accommodating customer needs.
Using insights to make redesigns, UX changes, messaging campaigns (like push, email and in-app) and to build stronger conversion funnels will boost ROI and make your app stand out in your brand’s overall marketing strategy.


